Analyzing metagenomes with STAMP
STAMP (Statistical Analysis of Metagenomic Profiles) is a software package for analyzing metagenomic profiles. A user friendly, graphical interface permits easy exploration of statistical results and generation of publication quality plots for inferring the biological relevance of features in a metagenomic profile.
STAMP takes as input two data files. The first is a profile file that contains the count data, and the second is an optional group metadata file that contains metadata about each of the samples to allow comparison of groups (e.g. sick vs healthy).
The group metadata file will need to be created by yourself, but is a simple tab-delimited format that can be easily exported from a spreadsheet program. The first column must have sample ids that match the profile file with each of the other columns representing different metadata about the samples.
An example group metadata file could look like this:
Sample Id    Location    Phenotype    Gender    Sample Size
Sample 1     Canada        Obese      Female      4000
Sample 2     Canada        Lean       Male        2000
Sample 3     Italy         Lean       Female      3000
To create the STAMP profile file you need to do a simple conversion of PICRUSt’s BIOM output from within the STAMP tool. Start up STAMP and click
File->Create STAMP profile from...->BIOM profile
Click “Load” and select the predicted_metagenomes.biom file from PICRUSt. Then do one of the following:
- If this is the output from
predict_metagenomes.pyscript then leave the Metadata field as<observation ids>. This will allow comparison of KEGG Orthologs. - If this is the output from
categorize_by_functions.pyscript then change the Metadata field toKEGG_Pathways. This will allow comparison of KEGG Pathways.
Then click “Create STAMP profile” and save as a new file with “.spf”.
Once you have your STAMP profile file and group metadata file generated, load the files from the File->Load Data… menu and start browsing your data.
The STAMP User’s Guide is very clear and helpful.
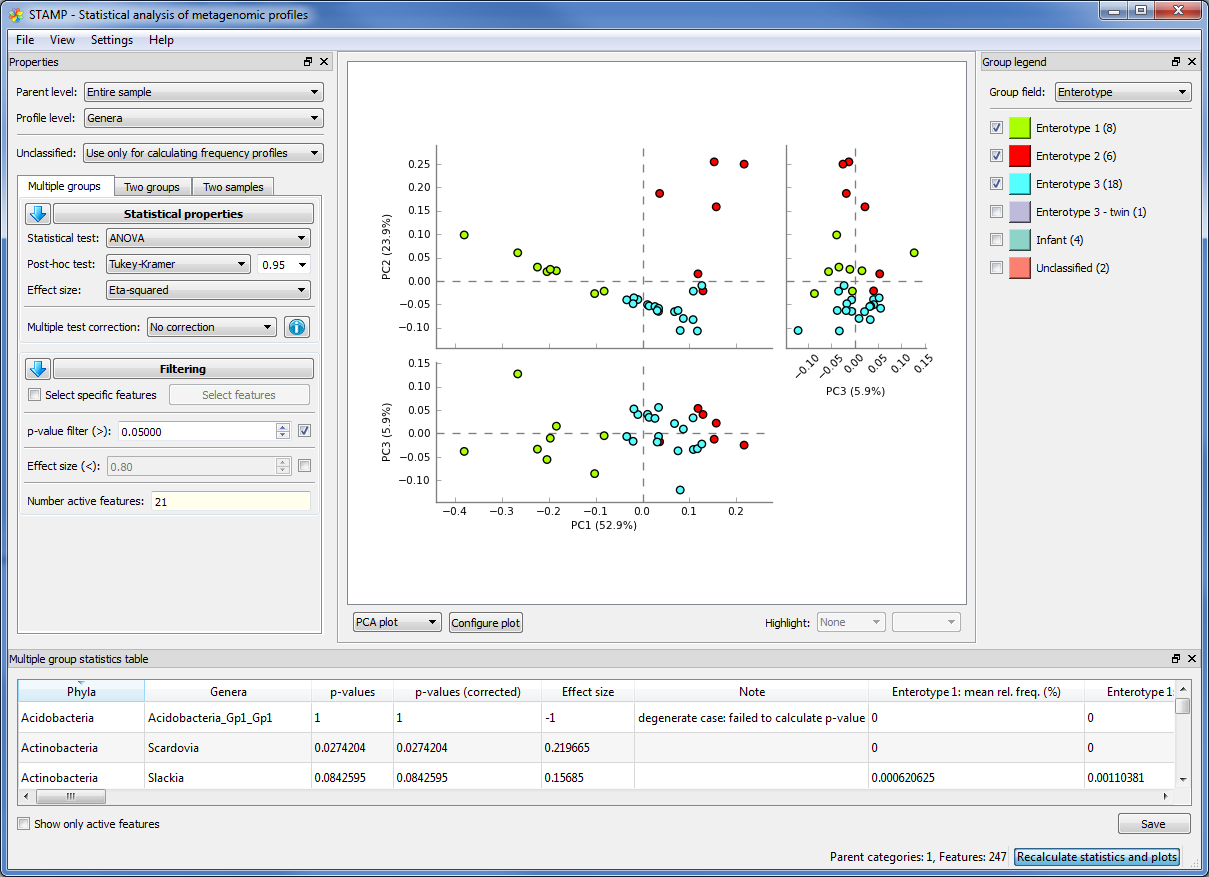
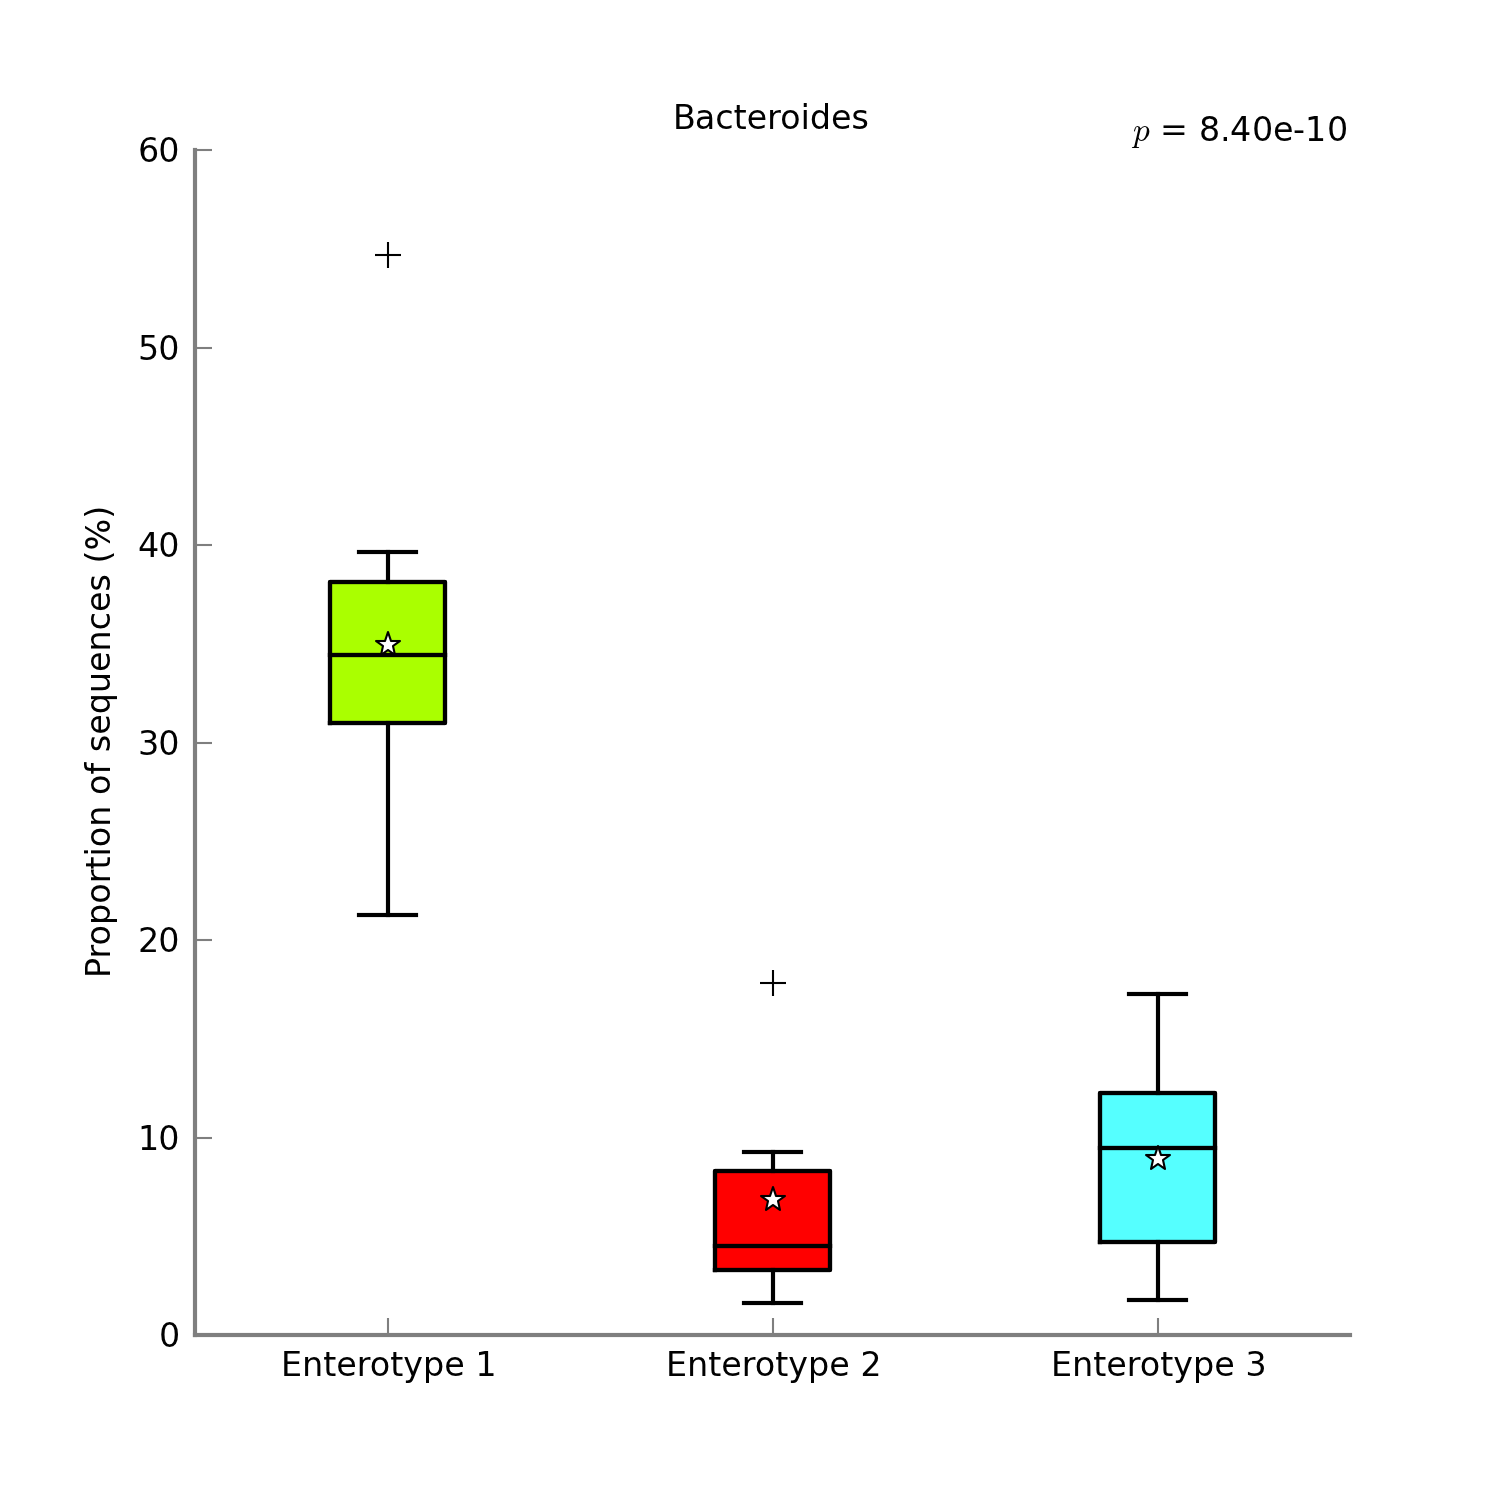
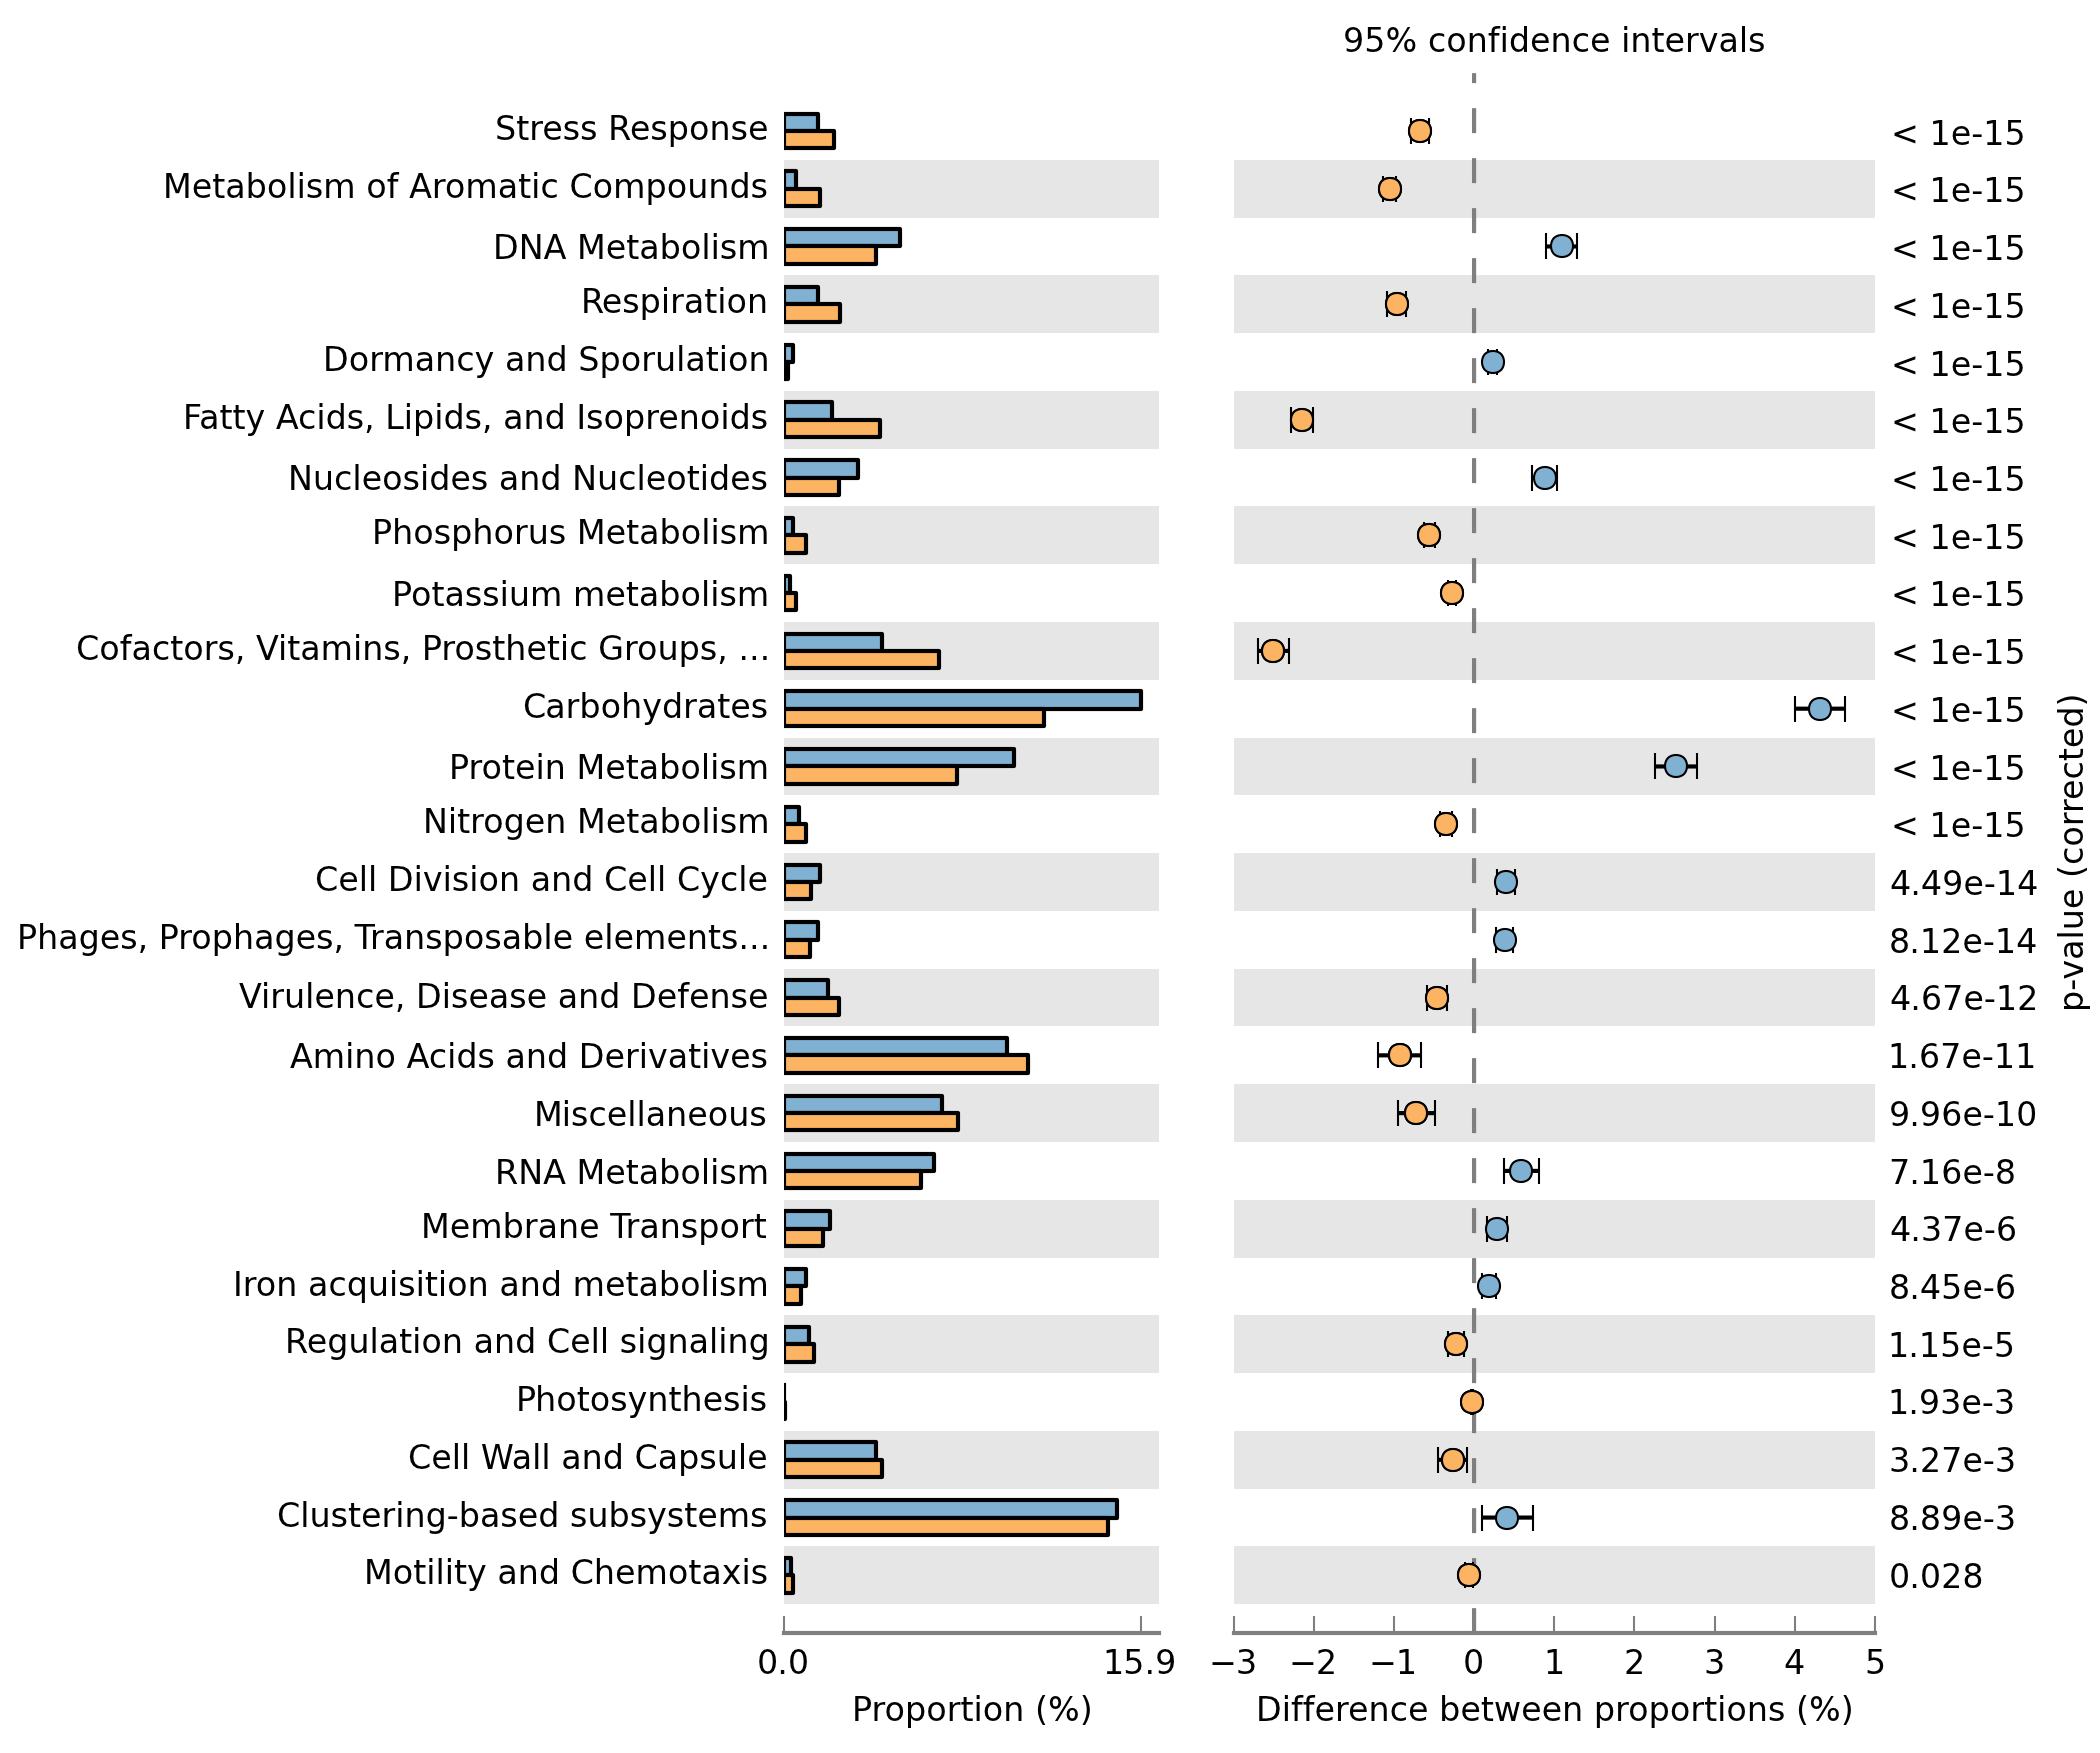
With only a few clicks you can generate figures like these: